RetireworX Planner™

Working with your client and entering the data takes less than five minutes and has your client actively engaged in establishing their retirement goals and patterns.
The all-in-one dashboard design of the product allows you and your client to see everything that impacts their retirement in one glance. The dynamic displays and charts create a clear picture for your client that eliminates all of the mystery of a successful retirement plan.


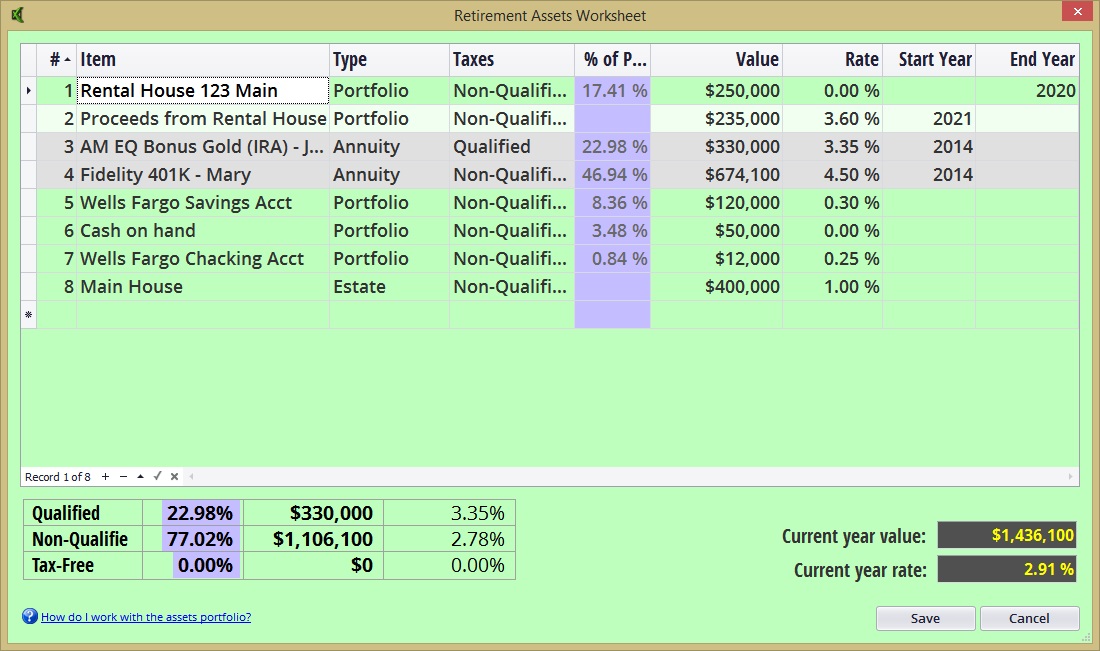
There are five basic asset types for any asset you enter:
- Portfolio — This is the default asset type. Funds allocated as portfolio are used to pay expenses as needed, until depleted.
- Estate — This asset's base and growth (if any) are NEVER touched to pay monthly expenses. It remains as an estate asset to be left to heirs.
- Life Insurance — When you select this as an asset, the system displays a Life Insurance Asset detail screen, where you enter all of the information from your life insurance exhibit. If an annual income is specified, then this asset's base and growth are not touched to pay monthly expenses.
- Annuity — When you select this as an asset, the system displays an Annuity Asset detail screen, where you enter all of the information regarding the annuity. If an yearly lifetime income is specified (or the "annuitized asset" box is checked, then this asset's base and growth are not touched to pay monthly expenses.
- IRA — When you select this as an asset, the system displays an IRA Asset detail screen, where you enter all of the information about the individual retirement account. Except for the fact that there are required minimum withdrawals for an IRA, this asset is treated as a simple portfolio asset in all other respects.
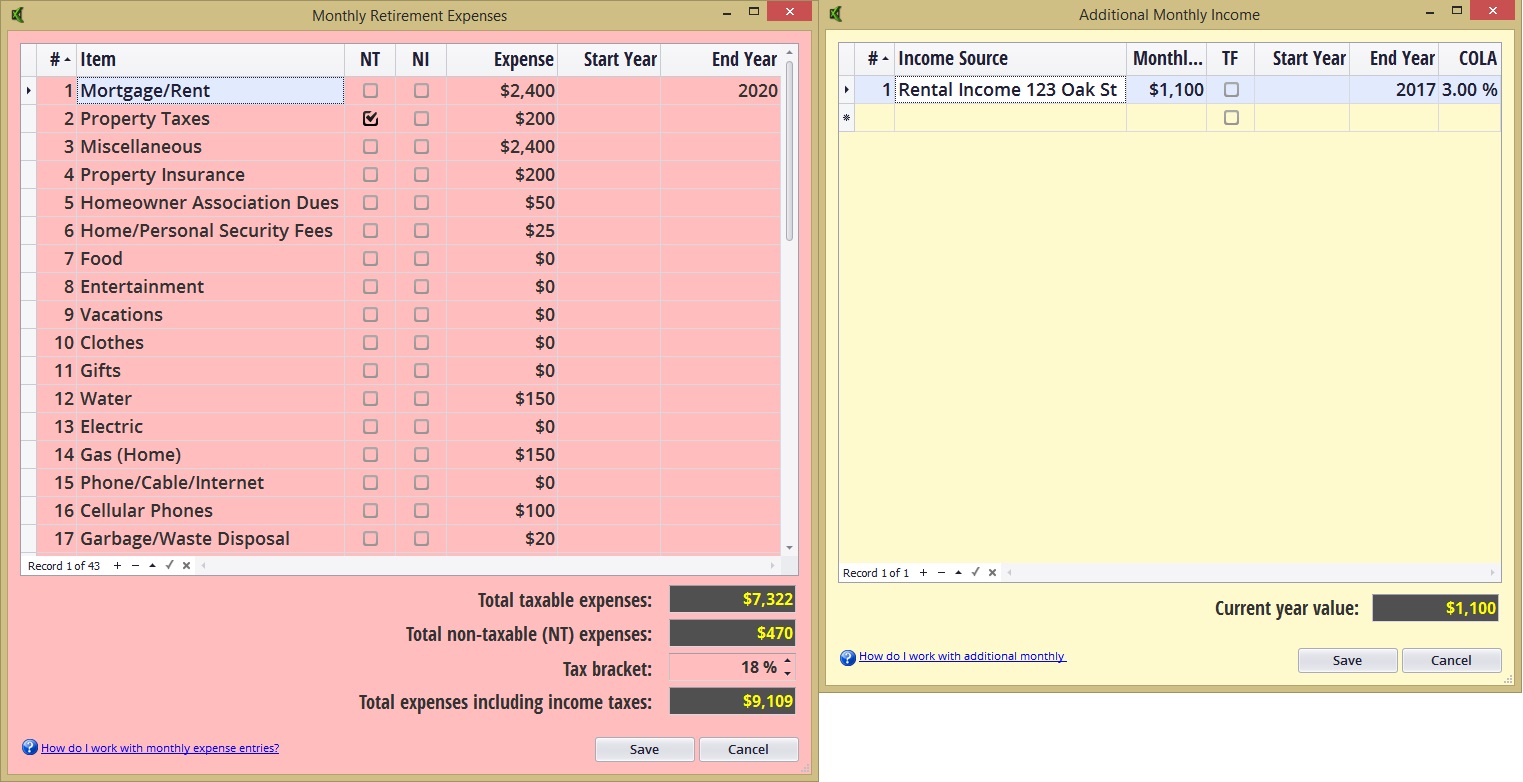
The monthly income worksheet and additional income worksheet make it easy to enter data into the plan in a logical and easy-to-follow sequence.


The Plan Summary area includes tabular and graphical displays depicting the effect of the client's plan on the retirement assets portfolio
RetireworX Planner™ makes immediate recommendations for adjustments to various parameters, including the year of retirement, monthly income needs, investment assets, pre- and post-retirement rate of return.
The charts show a vivid display of the results of the plan. Clicking on either graph will display a larger graph along with a table of the values that support the graph.

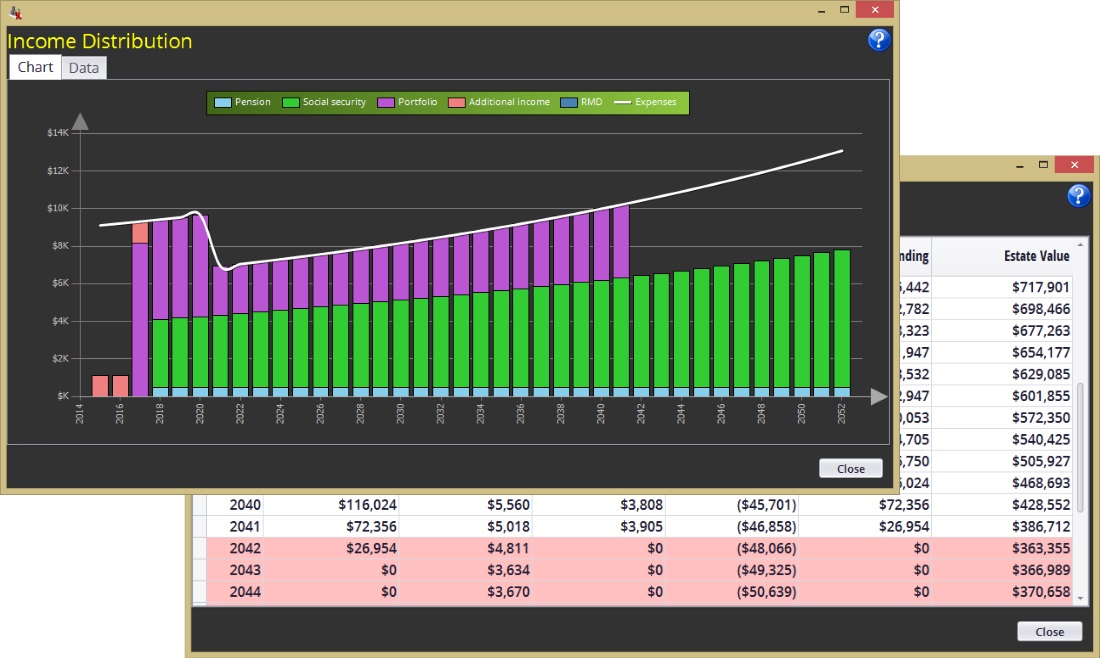
Monthly expenses
The Income Distribution Graph displays a yearly summary of the average monthly expenses. The Income Distribution Data Table displays a yearly summary of the average monthly expenses in tabular form. The red lines indicate that the portfolio is depleted and there is an income deficit.
Portfolio
The Retirement Assets Portfolio Graph displays a yearly summary of the year-end portfolio balance (shaded area). The green line above the shaded area shows the estate value and includes estate items and death benefits, if any. The Retirement Assets Portfolio Data Table displays a yearly summary of the impact on the portfolio. The red lines indicate that the portfolio is depleted and there is an income deficit.

Any reports are available through the drop-down box from the Reports menu. Each report may be printed separately, or a combined report may be printed.
- Client Input consists of 4 reports with all of the client's inputs from the dashboard and all three worksheets shown in the plan.
- The disclaimer reports display a statement with space for signature of both advisor and client to be included with any reports given to the client. There is both a copy for the client as well as the agent.
- Retirement Income and Asset Usage displays the plan summary in 5-year increments plus the two graphs.
- The Estate Value report shows the value of the estate at the maximum age.
- Retirement Income Distribution displays a year-by-year table of data pertaining to the client's retirement income distribution that includes social security, pension, and draw on portfolio.
- Portfolio Account Balance displays a year-by-year table of data pertaining to the client's portfolio account balance that includes starting balance, earnings/losses, amount used for income and ending balance.
- Combined Report displays all 7 client reports: Client Input (4), Disclaimers (2), Retirement Income and Asset Usage, Estate Value, Retirement Income Distribution and Portfolio Account Balance.